Vodyssey — Ads Report & Creative Gallery
May 1–4, 2026 · Account act_643543222721816 · Generated by Scarlett
Live Data
FB API v21
$6,622
Total Spend
43
Scheduled Calls
$154
Avg Cost/Call
21
Unique Creatives
10
Winning Creatives
4
Losing (> $50)
Campaign Comparison
| Campaign | Spend | Schedules | Cost/Call | Verdict |
|---|---|---|---|---|
| mk | schedule | 500 | wide | $963 | 6 | $161 | 🔥 Scale |
| mk | schedule | 500 | test 1 | $1,058 | 3 | $353 | ⚠️ Degrading |
| sm | schedule | classic-wide | $1,008 | 5 | $202 | ✅ Promising |
| mk | schedule | 500 | wide | ii | $888 | 1 | $888 | 🔴 Collapsed |
| mk | schedule | 500 | target | $1,090 | 1 | $1,090 | 🔴 Kill |
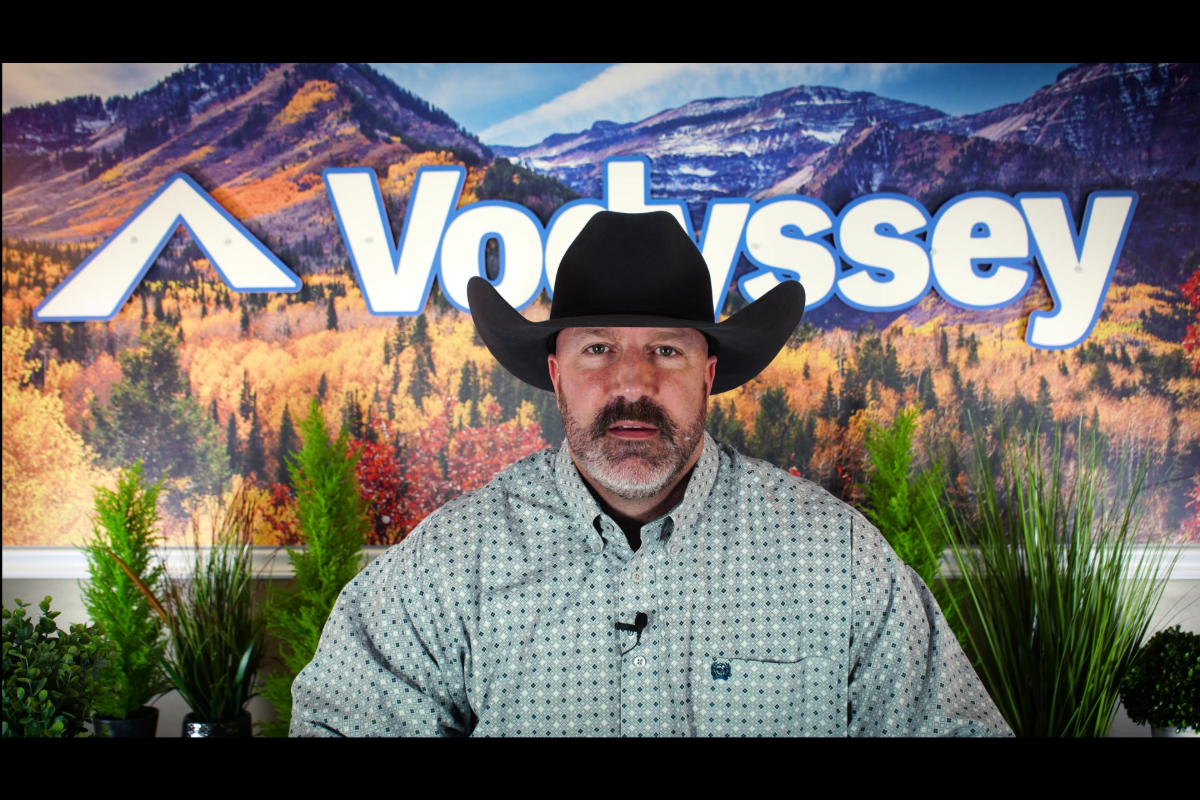
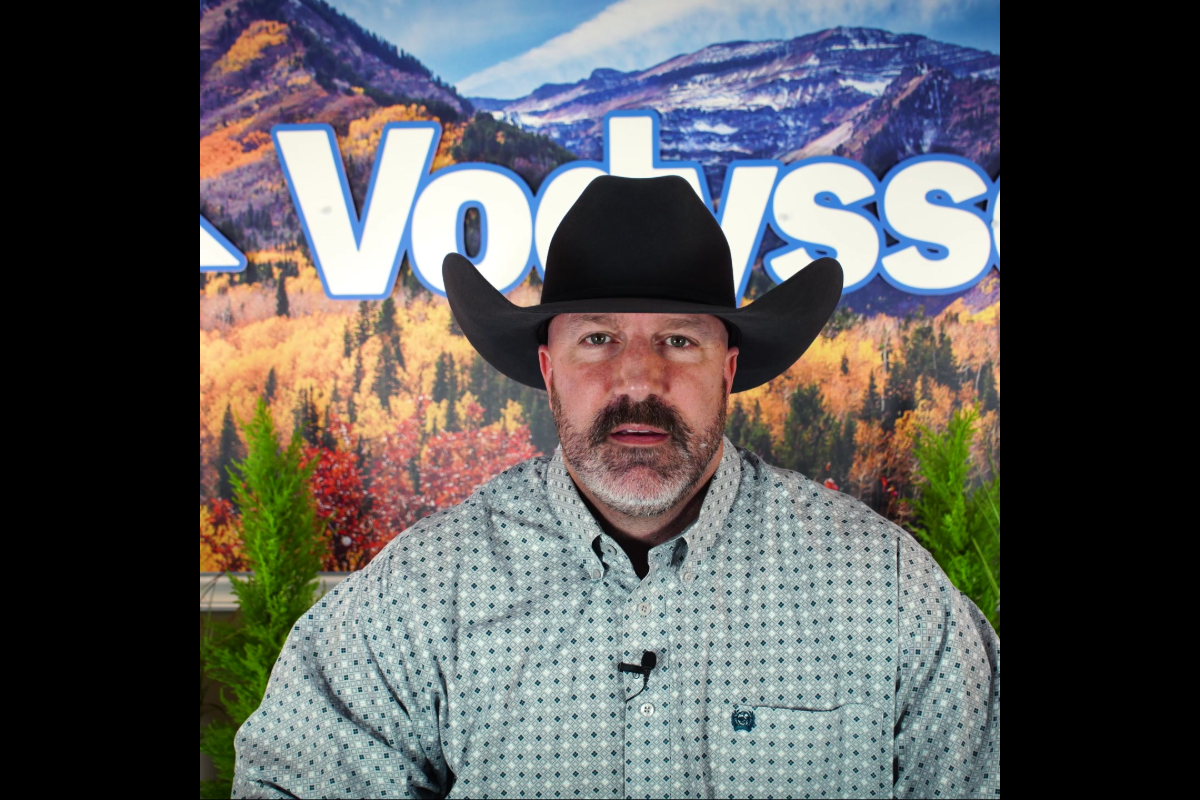
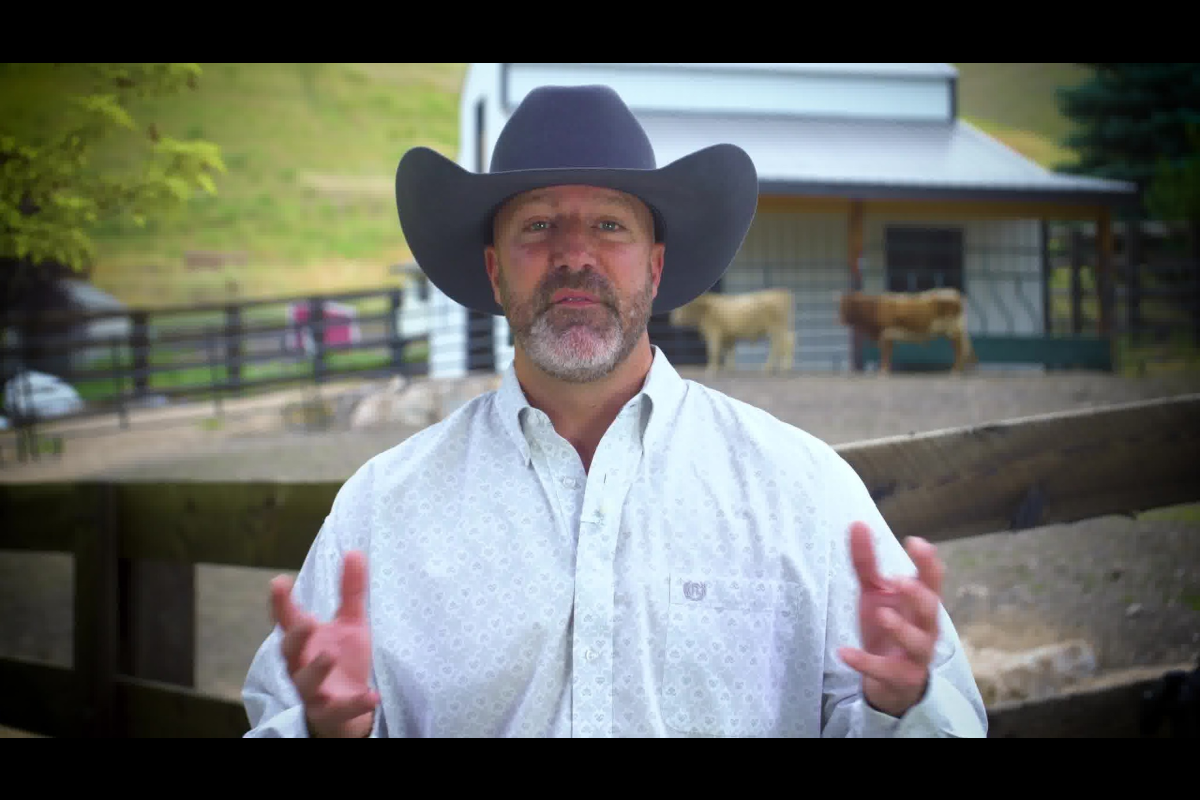
Winning Ads — 10 Creatives Driving All 43 Scheduled Calls
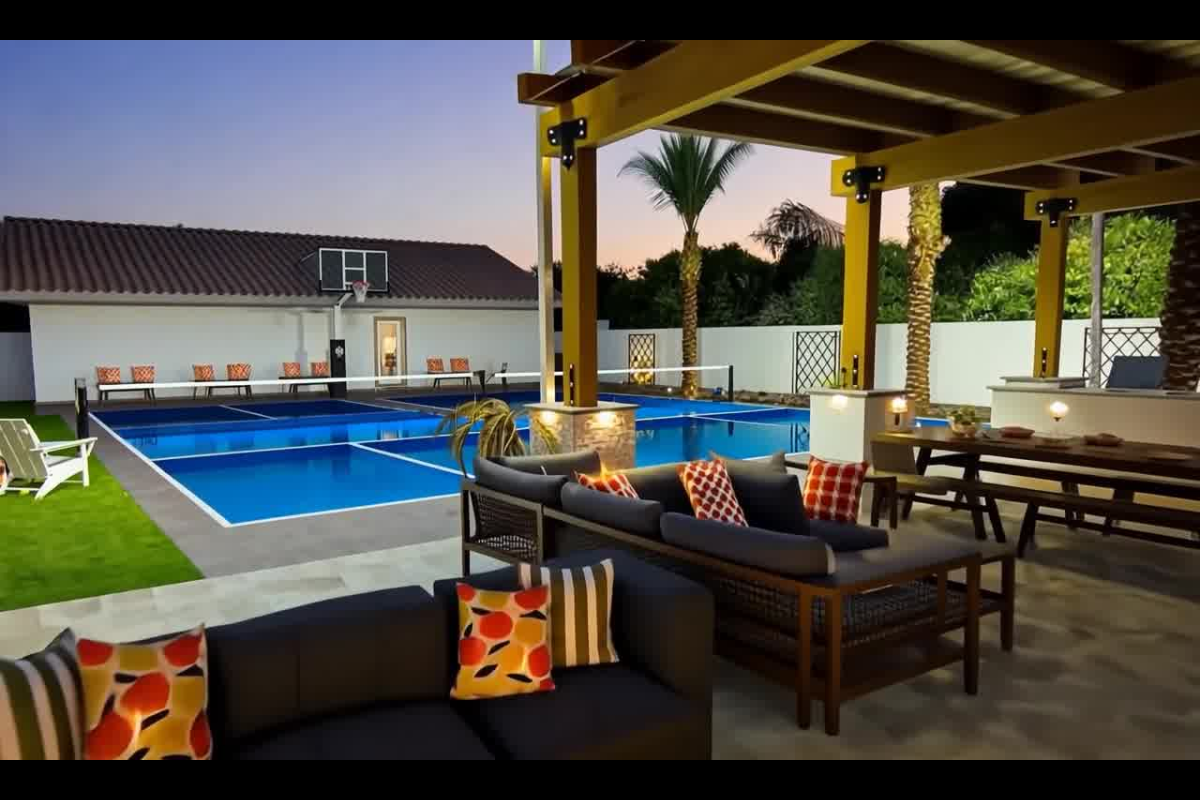
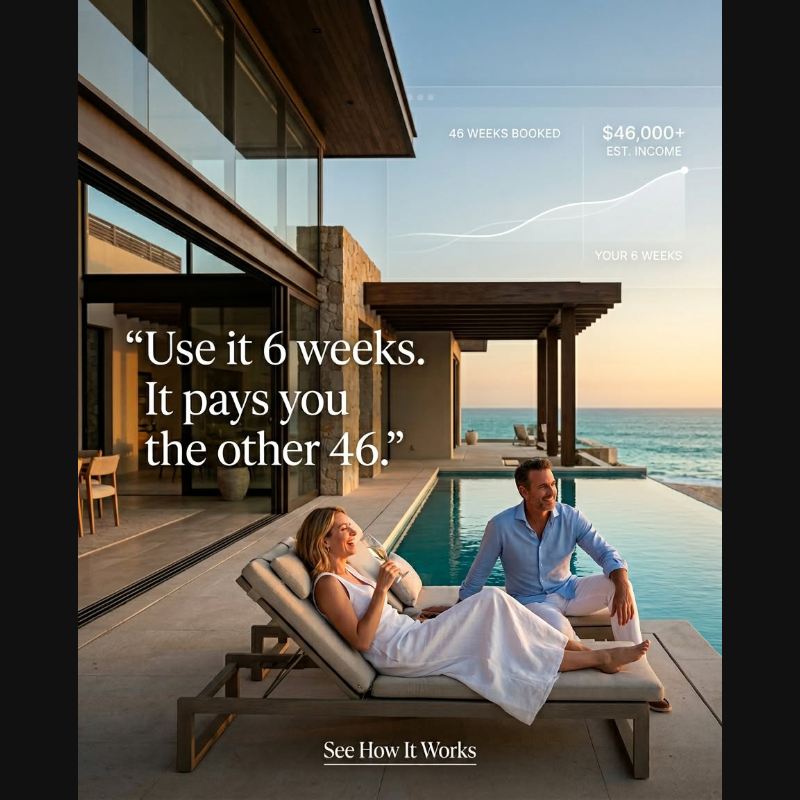
mk1 | $250k vid wide
14 calls
$1,670
Spend
$119
Cost/Call
0.92%
CTR

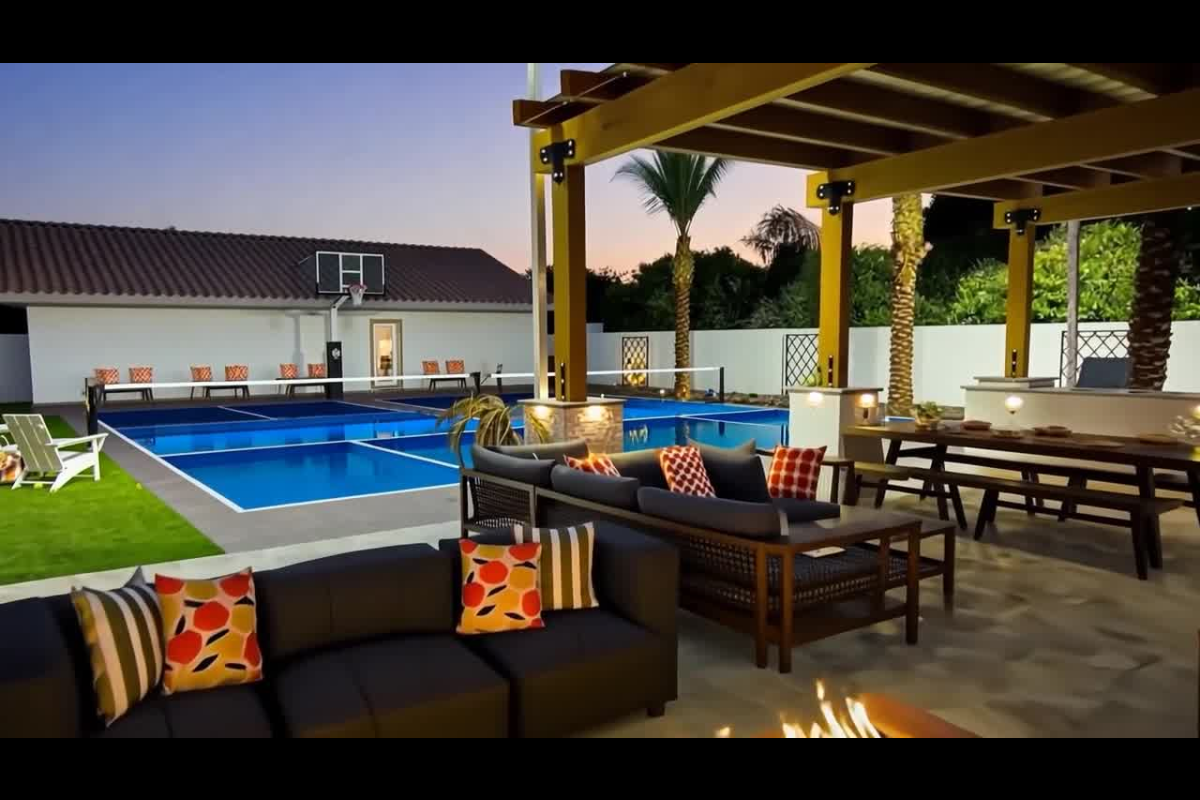
high income | lakeside ii
10 calls
$953
Spend
$95
Cost/Call
1.42%
CTR

mk6 | $250k vid v5
5 calls
$278
Spend
$56
Cost/Call
0.67%
CTR

high income | $1M article
4 calls
$998
Spend
$250
Cost/Call
0.68%
CTR

lakeside | $1M article v2
2 calls
$458
Spend
$229
Cost/Call
0.51%
CTR

lakeside | $1M article v3
2 calls
$442
Spend
$221
Cost/Call
0.49%
CTR
mk2 | STR owner vid
2 calls
$445
Spend
$223
Cost/Call
1.05%
CTR
mk3 | $250k vid v2
2 calls
$538
Spend
$269
Cost/Call
0.88%
CTR
mk8 | high income lake II vid
1 call
$388
Spend
$388
Cost/Call
0.61%
CTR
book | $7.95 v1
1 call
$48
Spend
$48
Cost/Call
1.85%
CTR
Losing Ads — Budget Draining With Zero Calls
mk10 | $250k vid v8
0 calls
$156
Spend
$0
Cost/Call
0.55%
CTR
mk4 | $250k vid v3
0 calls
$85
Spend
$0
Cost/Call
0.72%
CTR
mk5 | $250k vid v4
0 calls
$61
Spend
$0
Cost/Call
0.45%
CTR

book | $7.95 v2
0 calls
$52
Spend
$0
Cost/Call
2.04%
CTR
Optimization Brief
What's Working
- mk | wide: $161/call, 6 calls. Consistent across months. xp2 ad set at $35/call.
- sm | classic: $202/call, 5 calls + 175 pixel events at $5.76 each.
- Creative #16 (mk1): $1,670 spent, 14 calls at $119/call. The workhorse.
- Broad Advantage+: Crushing LAL-based targeting by 3-5x.
What's Broken
- target campaign: $1,090/call. LAL approach failed. Kill immediately.
- wide | ii: Collapsed from $231 to $888/call. 4 of 5 ad sets have 0 conversions.
- test 1: Degrading from $132 to $353/call. Only 1 ad set producing.
- Dead ad sets: ~$730 spent on ad sets with zero scheduled calls.
P0 Actions
- 1. Pause target campaign: Save ~$269/day immediately.
- 2. Kill dead ad sets in wide|ii: xp2/xp3/xp4/branded → ~$170/day saved.
- 3. Scale wide: Increase budget to $500/day. Proven at $157/call.
- 4. Move winning creative: mk1 (#16) into every ad set.
Data: Facebook Marketing API v21.0 · Source: act_643543222721816 · May 1–4, 2026
Images captured via Puppeteer from FB ad creative endpoints · Generated by Scarlett